You Never Learn Alone (YNLA)
YNLA is the place for learning. Take one of our courses and climb the ladder to success.
Benefits of Learning with YNLA
YNLA allows you to learn at your own pace and on your own schedule. Whether you’re a busy professional, a full-time student, or someone with a hectic lifestyle, our flexible learning options ensure that you can fit education into your life.
Explore a diverse range of courses covering topics such as Technology, Business, Creative Arts, Languages, and more. With hundreds of courses to choose from, there’s something for everyone, regardless of your interests or career goals.
Learn from industry experts and experienced professionals who are passionate about sharing their knowledge and expertise. Our instructors bring real-world insights to the virtual classroom, ensuring that you receive practical, actionable advice and guidance.
Access YNLA’s courses from anywhere in the world, at any time. Our platform is fully responsive and compatible with all devices, including desktops, laptops, tablets, and smartphones, so you can learn on the go.

Explore Our Popular Courses

About Us
Welcome to the YNLA
Learning should always be a communal affair. With one of our courses you never have to learn alone.
-
More than 1000 courses to choose from -
Accredited certificates for completing a course -
Courses from all kinds of instructors
Frequently Asked Questions (FAQ)
Can I access YNLA courses on my mobile device?
Yes, YNLA is fully responsive and optimized for mobile devices. You can access our courses on your smartphone or tablet, allowing you to learn anytime, anywhere, even on the go.
Are there any prerequisites for YNLA courses?
Most of our courses are designed to be accessible to learners of all levels, from beginners to experts. Prerequisites, if any, will be clearly outlined on the course description page.
Absolutely! YNLA offers self-paced learning, allowing you to progress through the course materials at your own speed. You can revisit lessons as needed and take breaks whenever necessary.
Is there a certificate of completion?
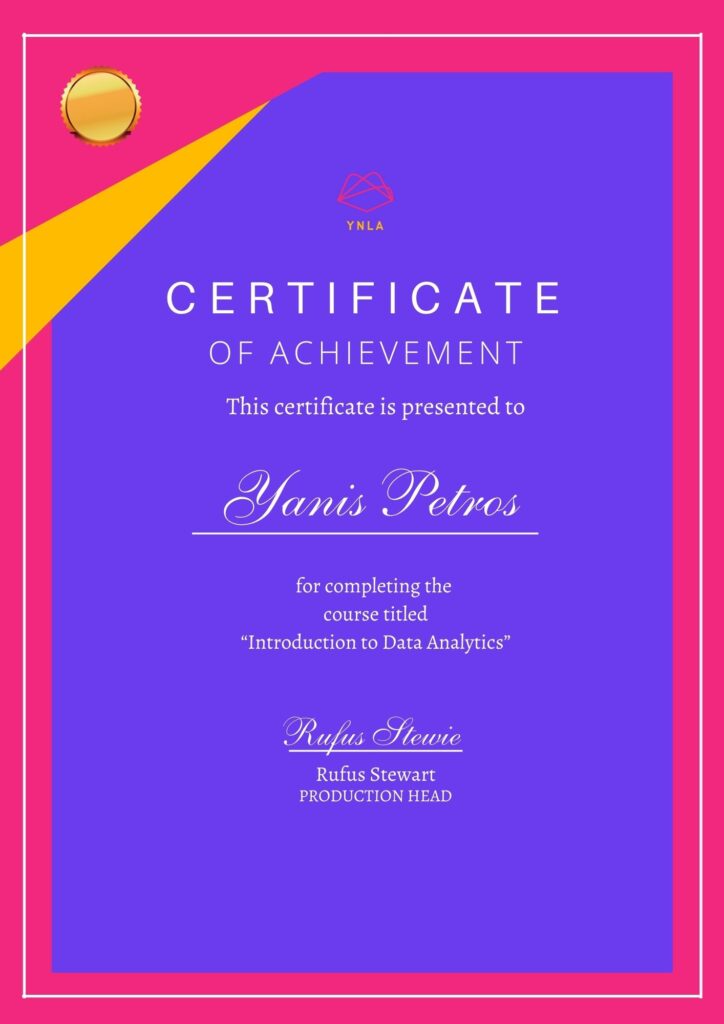
Yes, upon successfully completing a course, you’ll receive a certificate of completion from YNLA. This certificate can be added to your resume or LinkedIn profile to showcase your new skills and knowledge.


Get an Accredited Certificate
“Every online course takes a great deal of effort to complete. We believe it’s only fair that you are rewarded for your efforts. After you complete a course, you are eligible for a PDF certificate.
Contact us for your accredited certificate.”
Hear From Our Students
"YNLA has been an invaluable resource for advancing my career in marketing. The courses are well-structured, engaging, and taught by industry experts. Thanks to YNLA, I've gained the skills and confidence to take on new challenges and excel in my role."
James Peterson
Marketing Manager
"As a stay-at-home parent, finding time for professional development can be challenging. YNLA's flexible learning options allow me to learn at my own pace, from the comfort of my home. The courses are comprehensive and easy to follow, making it possible for me to enhance my skills while juggling my responsibilities."
Sarah Li
Stay-at-Home Parent
"YNLA's coding courses have been instrumental in helping me transition to a career in web development. The curriculum is comprehensive, with hands-on projects that provide practical experience. With the support of YNLA's instructors and community, I was able to land my dream job in tech."
Ruth Pierce
Web Developer
"As an entrepreneur, I'm constantly seeking ways to grow my business and stay ahead of the competition. YNLA's business courses have been a game-changer for me. The insights and strategies I've learned have helped me streamline operations, increase efficiency, and drive growth for my company."
Michael Wong
Entrepreneur


